Criteria
Visualization & Model
Eric Rabinowitz
Data collection
Nate Turley
Curator
Natasha Matteson
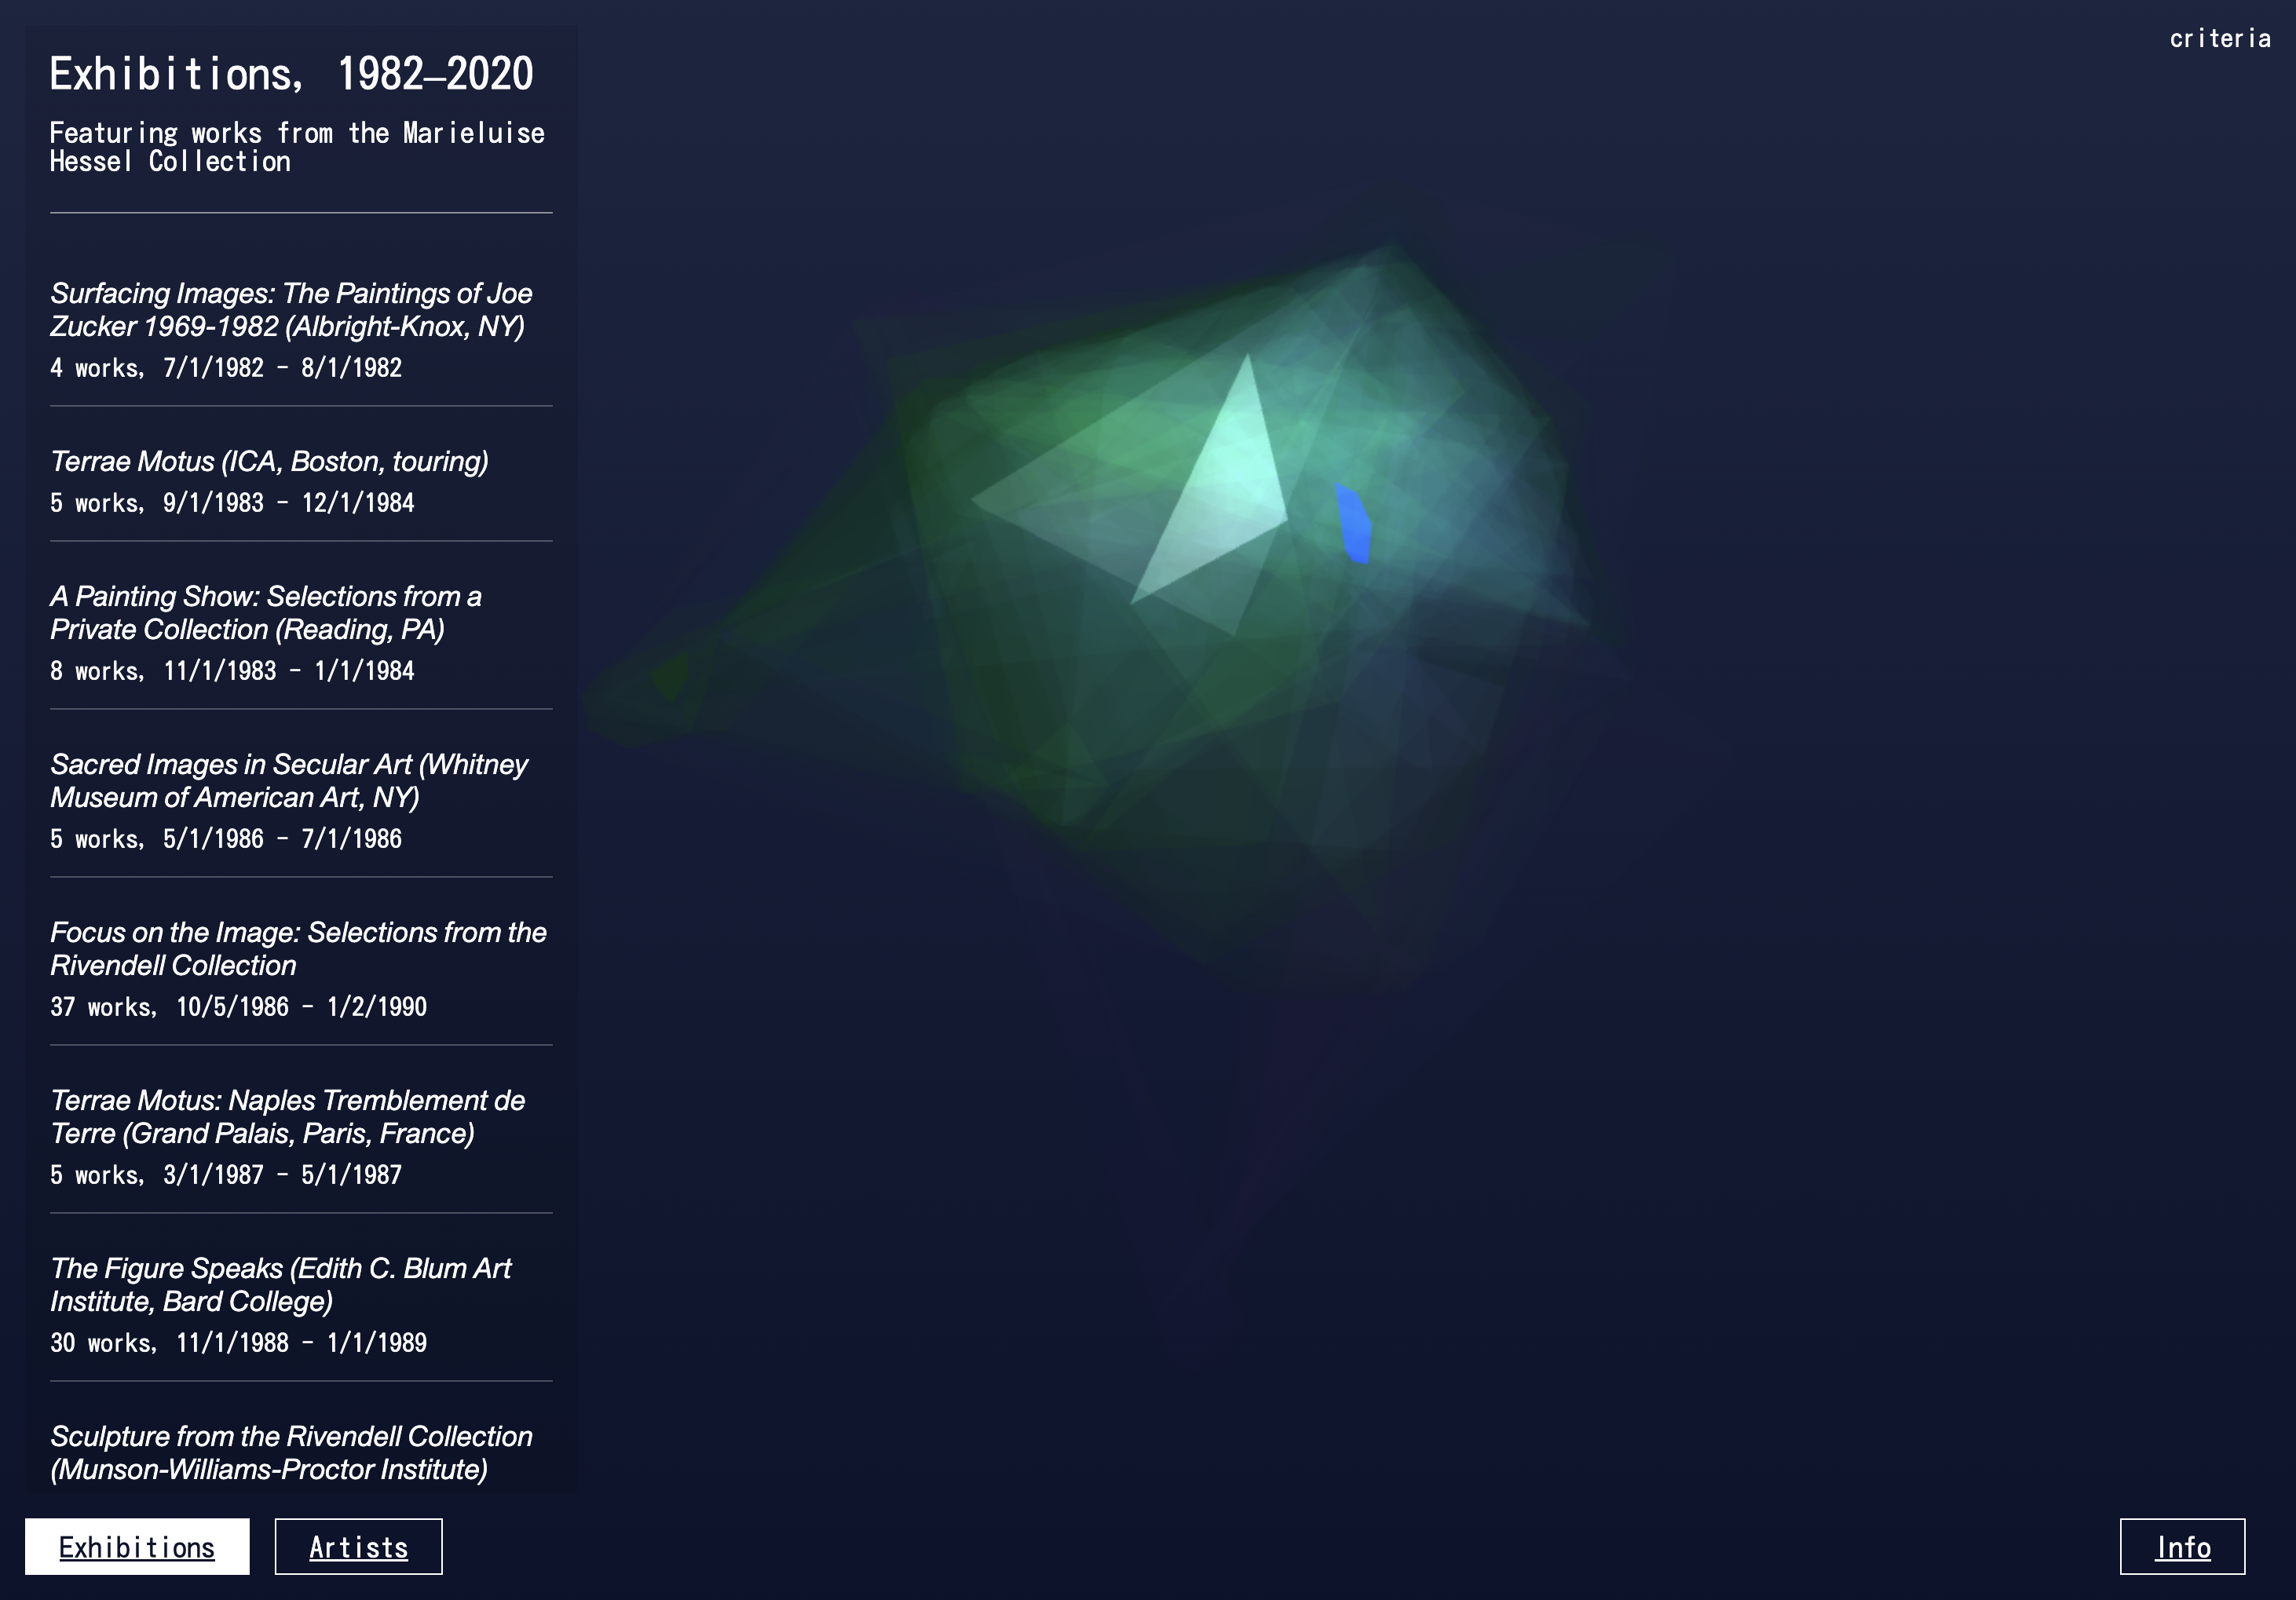
Data visualization of artworks from the Marieluise Hessel Collection at CCS Bard and how they have been exhibited together over the years. A component of thesis exhibition by Natasha Matteson. Using machine learning, artworks are assigned 3d coordinates based on exhibition history.


Vizualization of all exhibitions from the collection

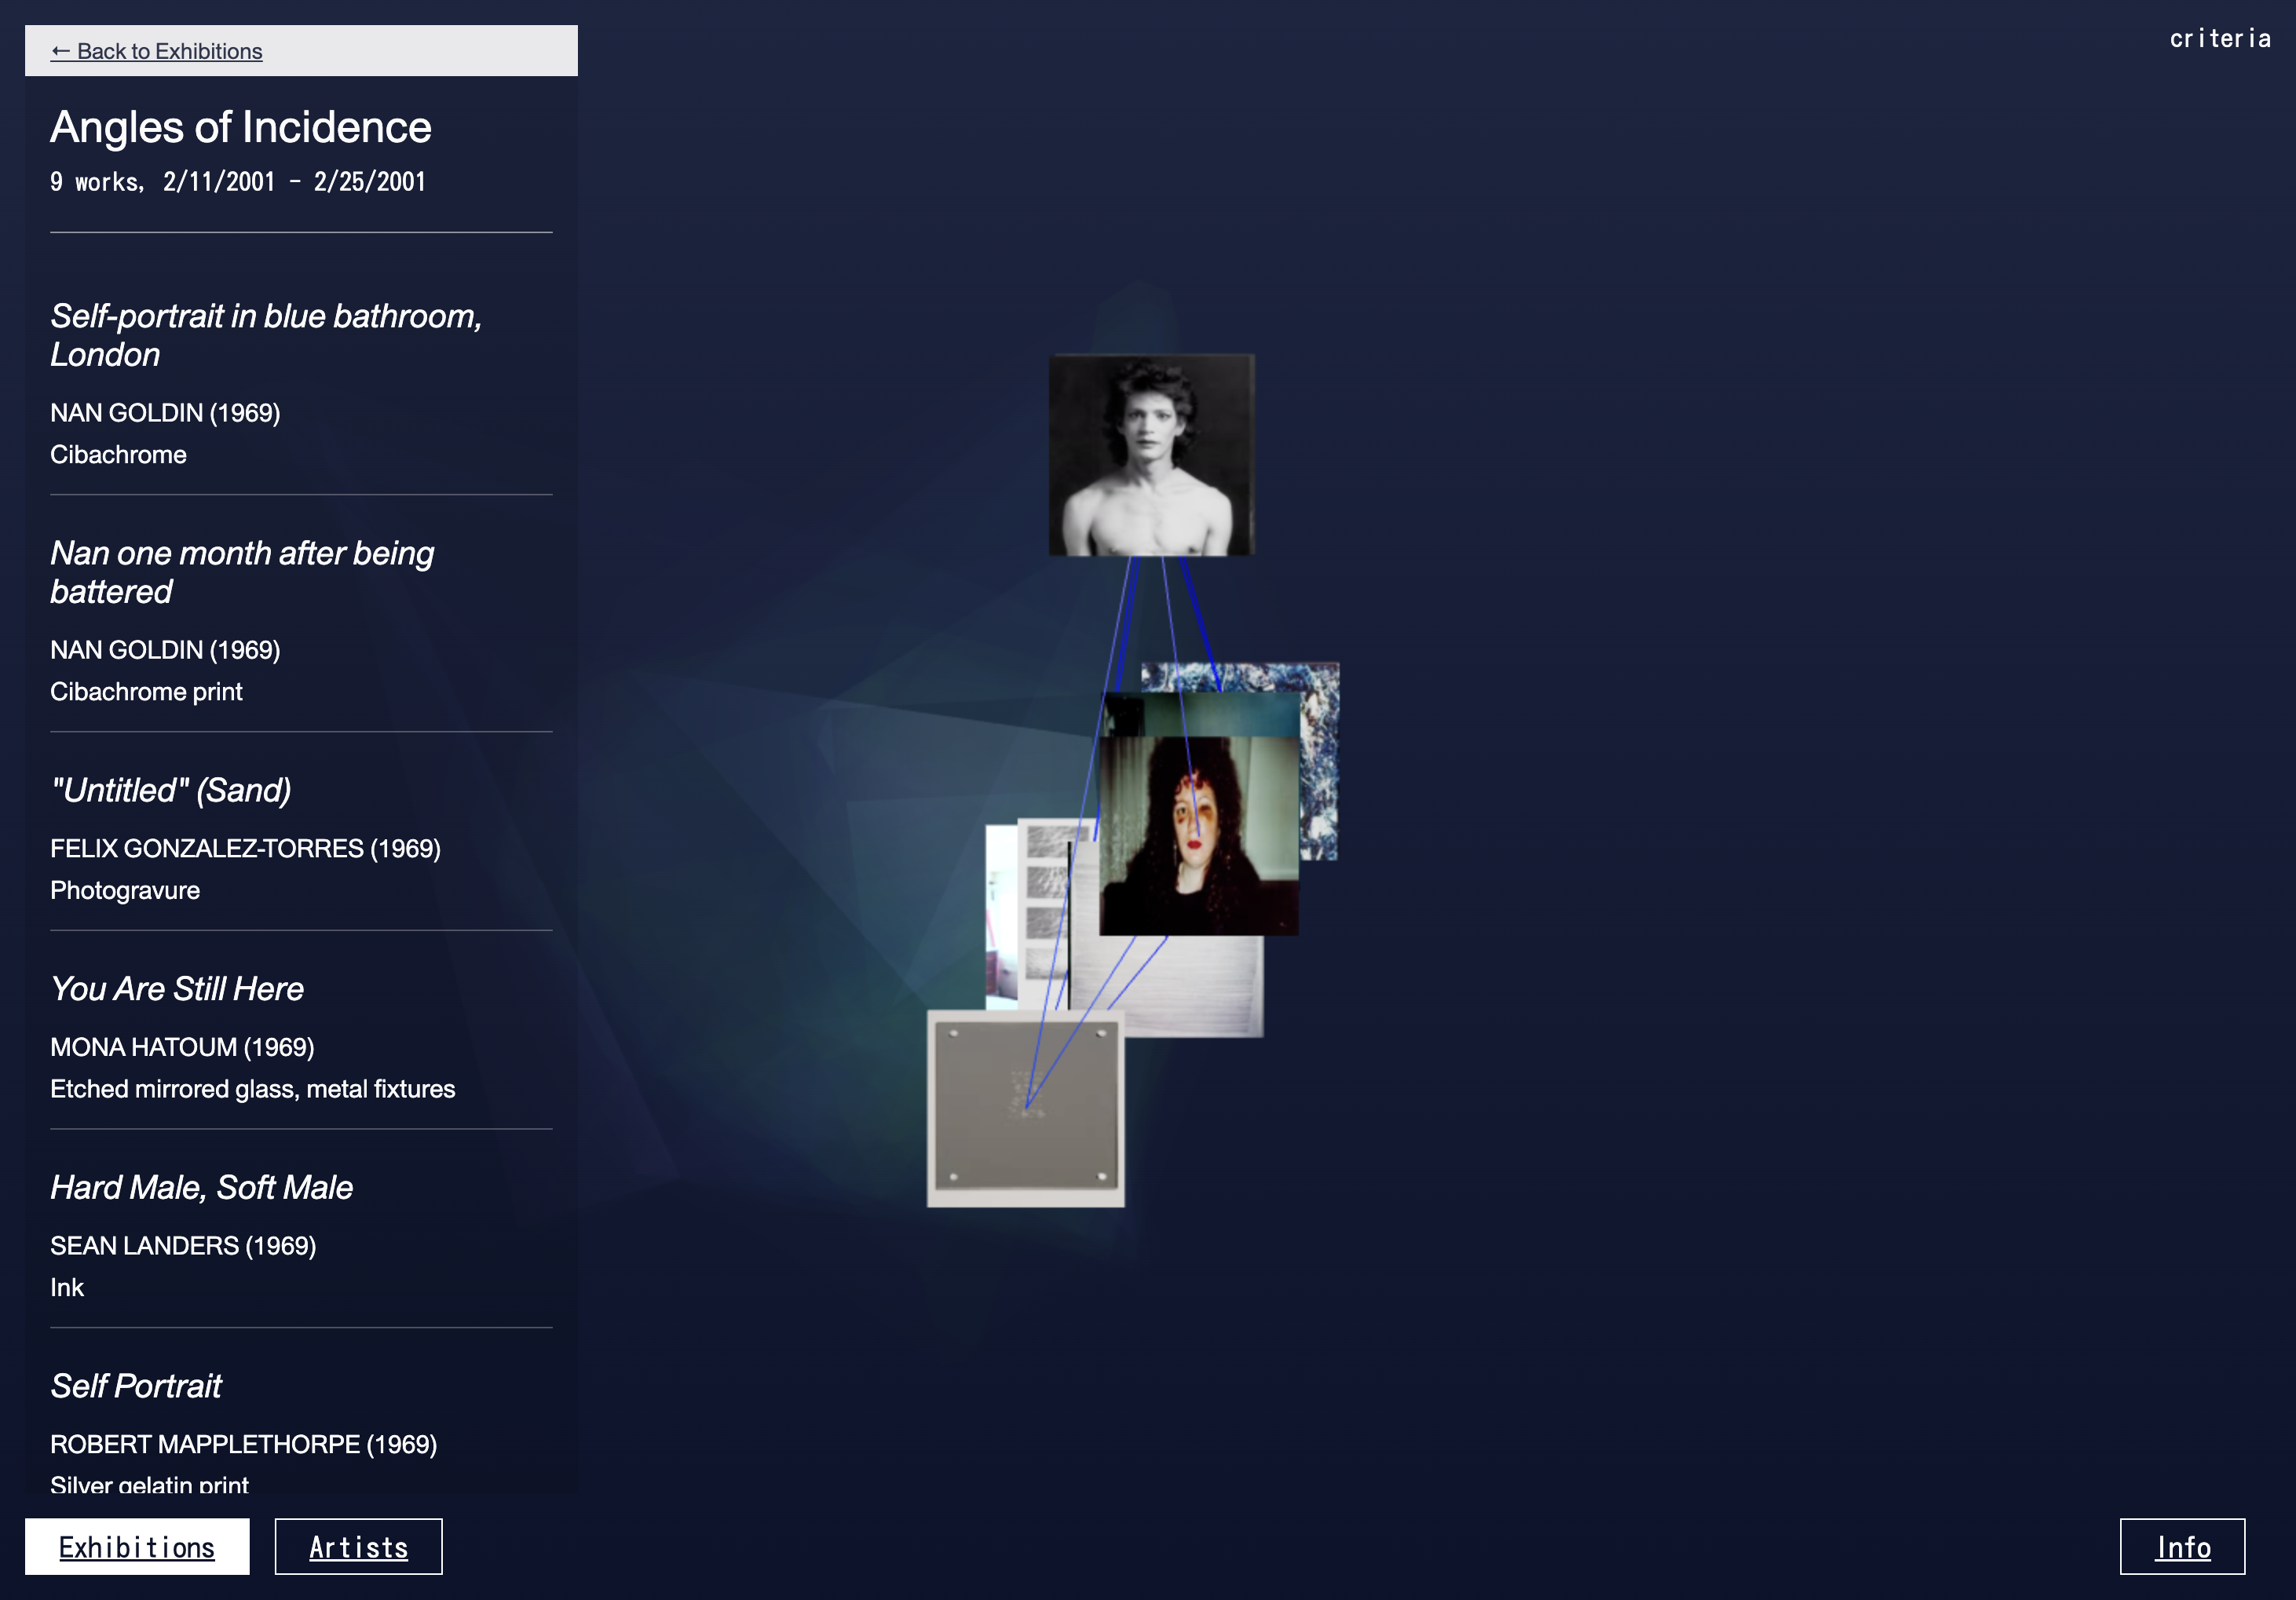
Viewing the artworks in a selcted exhib
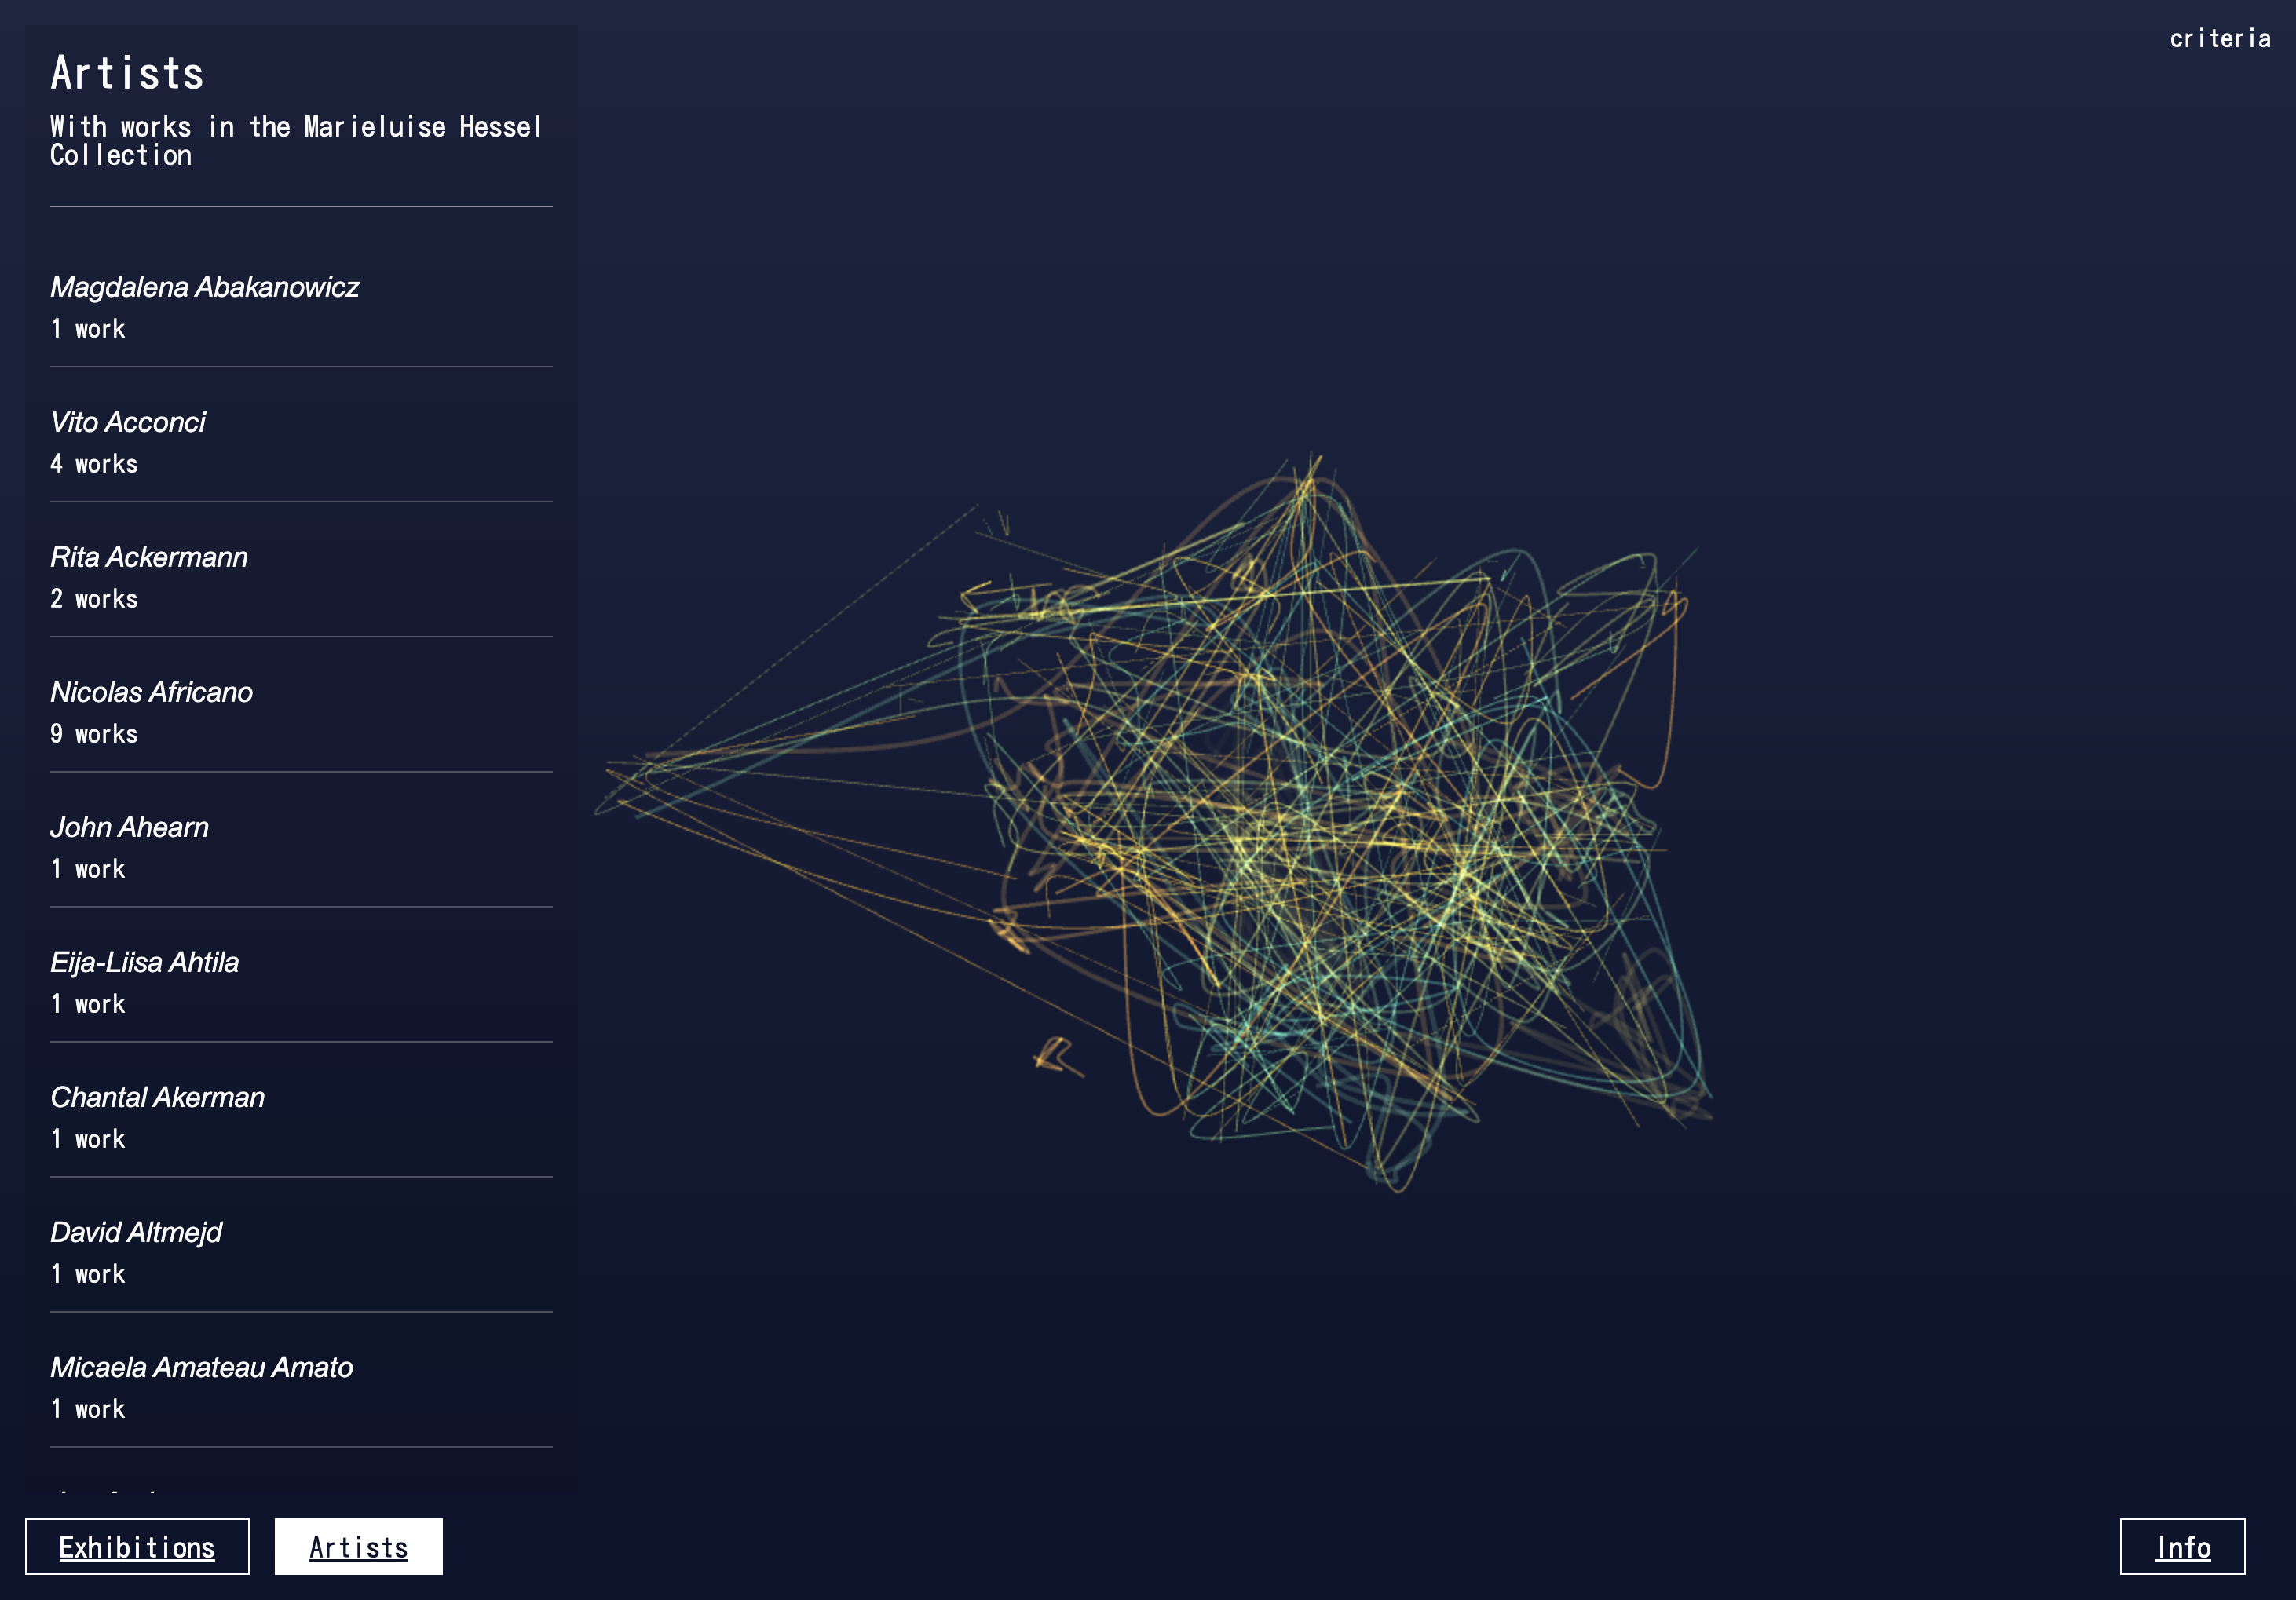
The visualization was created by using Machine Learning on the collection's exhibition data. Each artwork is given a 3-dimensional point in space. Artworks that appeared in an exhibition together are positioned more closely together and vice versa. The exhibitions are visualized as solid shapes connecting the works shown in each. The artists are visualized as curved lines connecting through their collected works over time.
